Propellor Introduction
Propellor gathers all of your data in one location, allowing you to monitor performance and gain insights instantly. We will go through some important features in this page to assist you in automating reports and better managing your data.
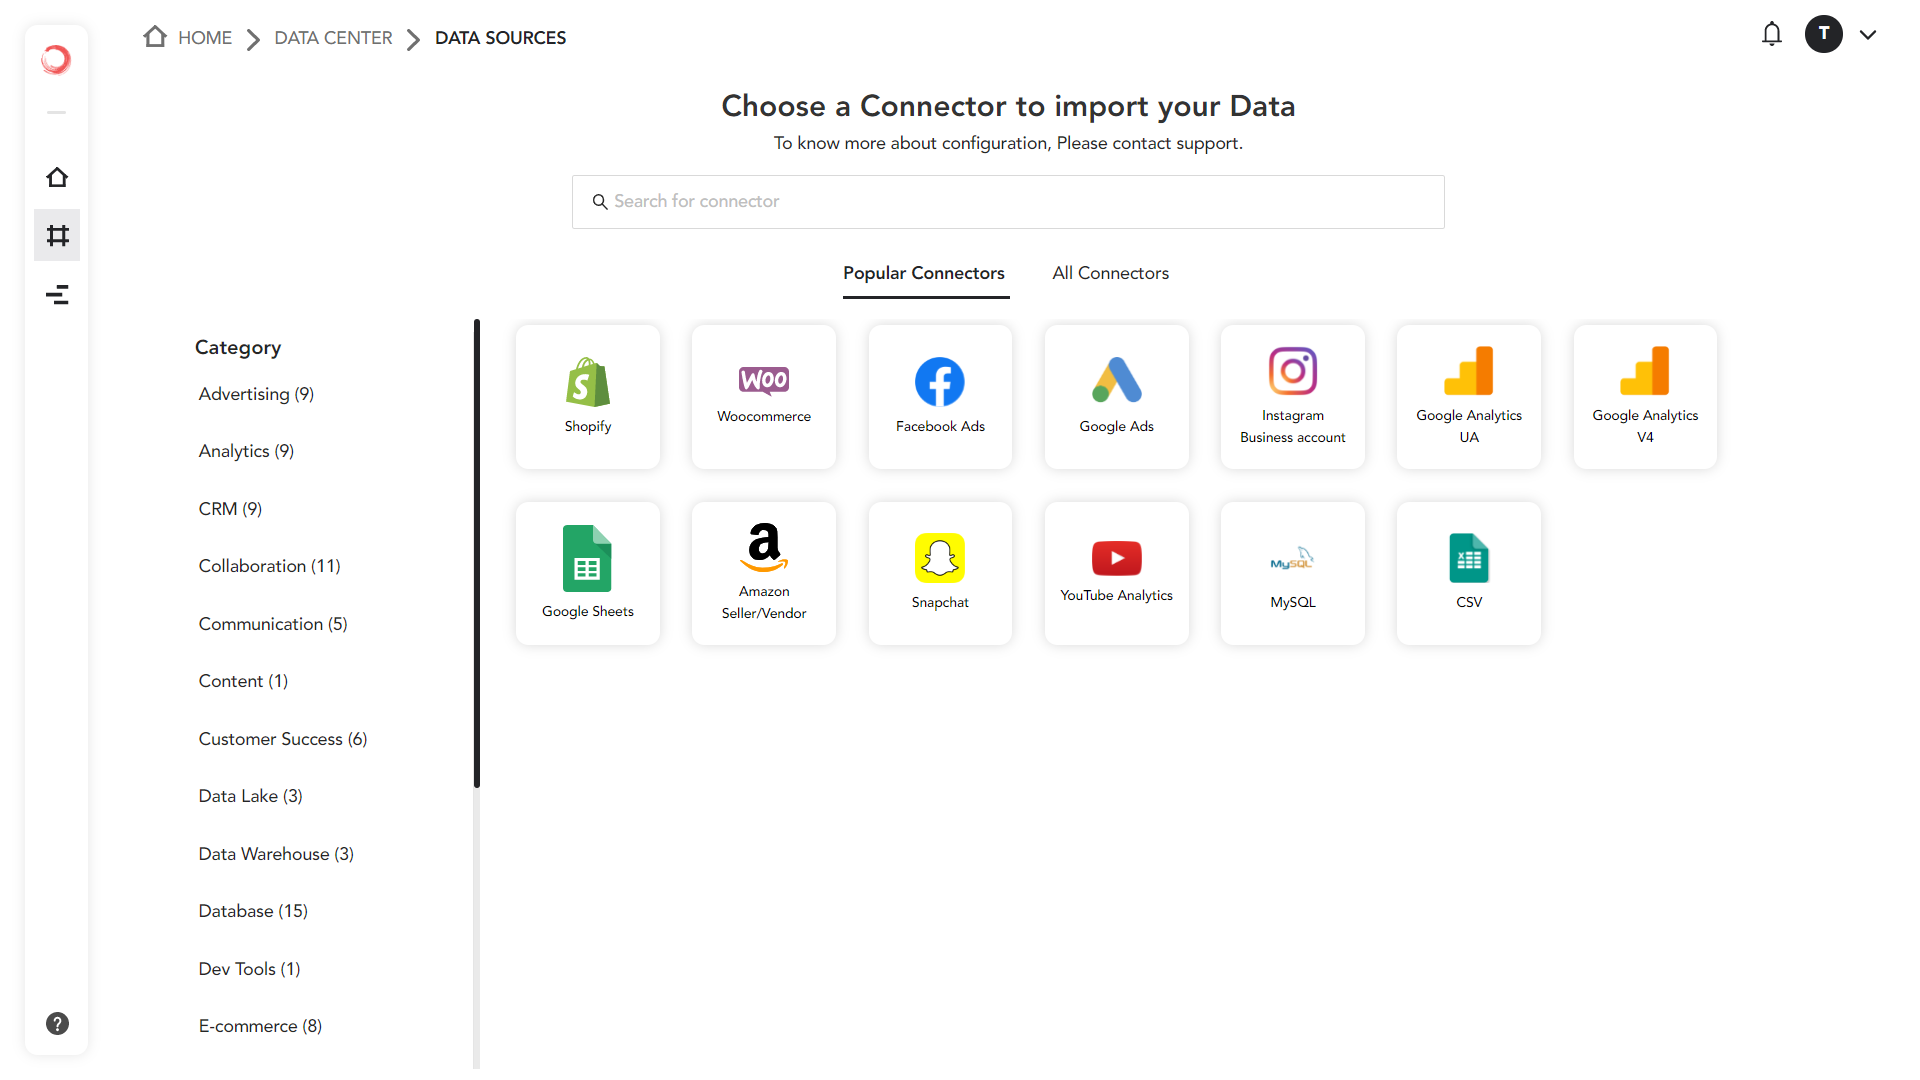
Connectors
You may directly connect your Data Sources in Propellor with Bond's 150+ integrations. Regular data syncs and almost real-time dashboards are made possible by this.
Data Sources include:
- Advertising-related data sources include Google Ads, Facebook Ads, Snapchat Ads, and others.
- Analytics related data sources like Google Analytics UA, YouTube Analytics, Google Analytics v4, etc.
- E-Commerce data sources including Shopify, Woocommerce, Amazon Seller Partner, and other e-commerce platforms and numerous others, with constant additions being made regularly.
Learn more about Connectors here.
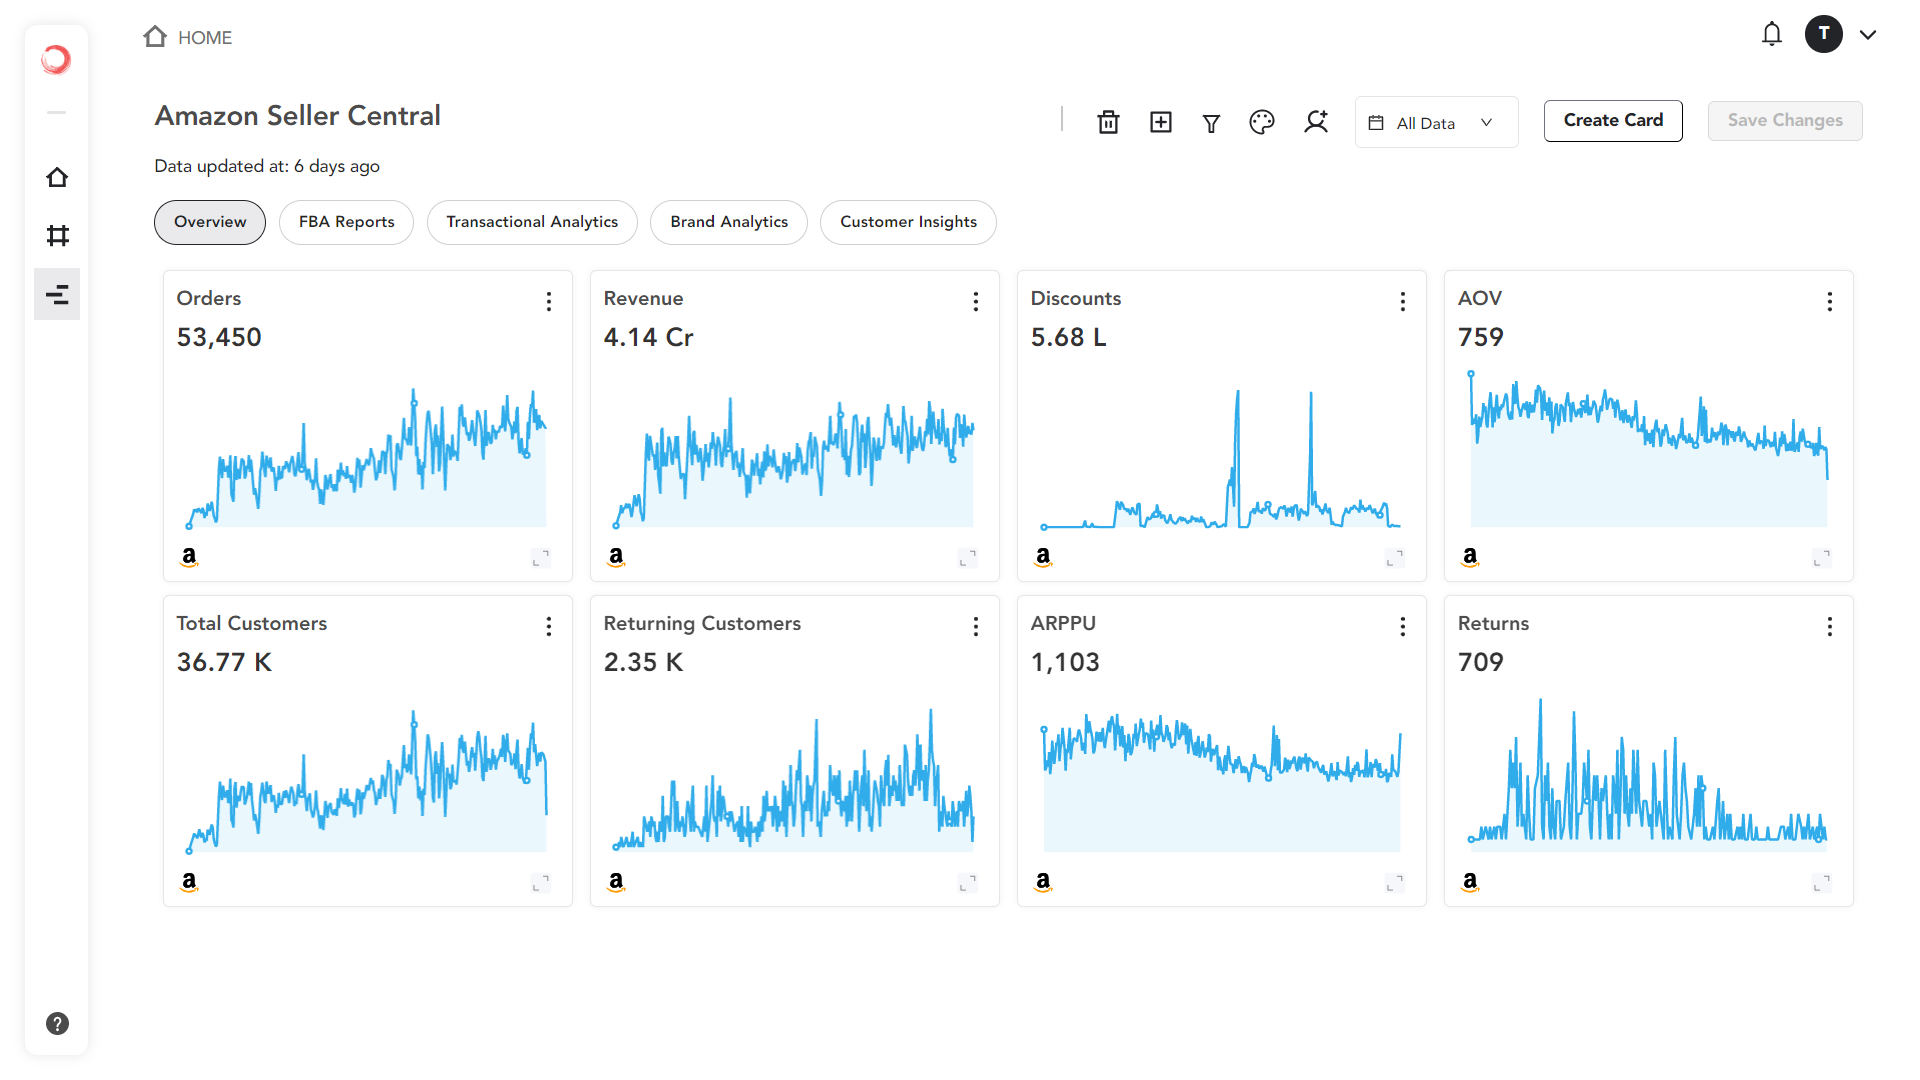
Dashboards
Dashboards are a collection of cards that provide you with a summary of the metrics and reports that are most important to you. Dashboards let you monitor many metrics at once. Each card inside a dashboard is a combination of a metric and the visualization type on the dashboard. There are many different Data visualizations available, including Line Graphs, Pie Charts, Donut charts, Bubble charts, and more.
Learn more about Dashboards here.
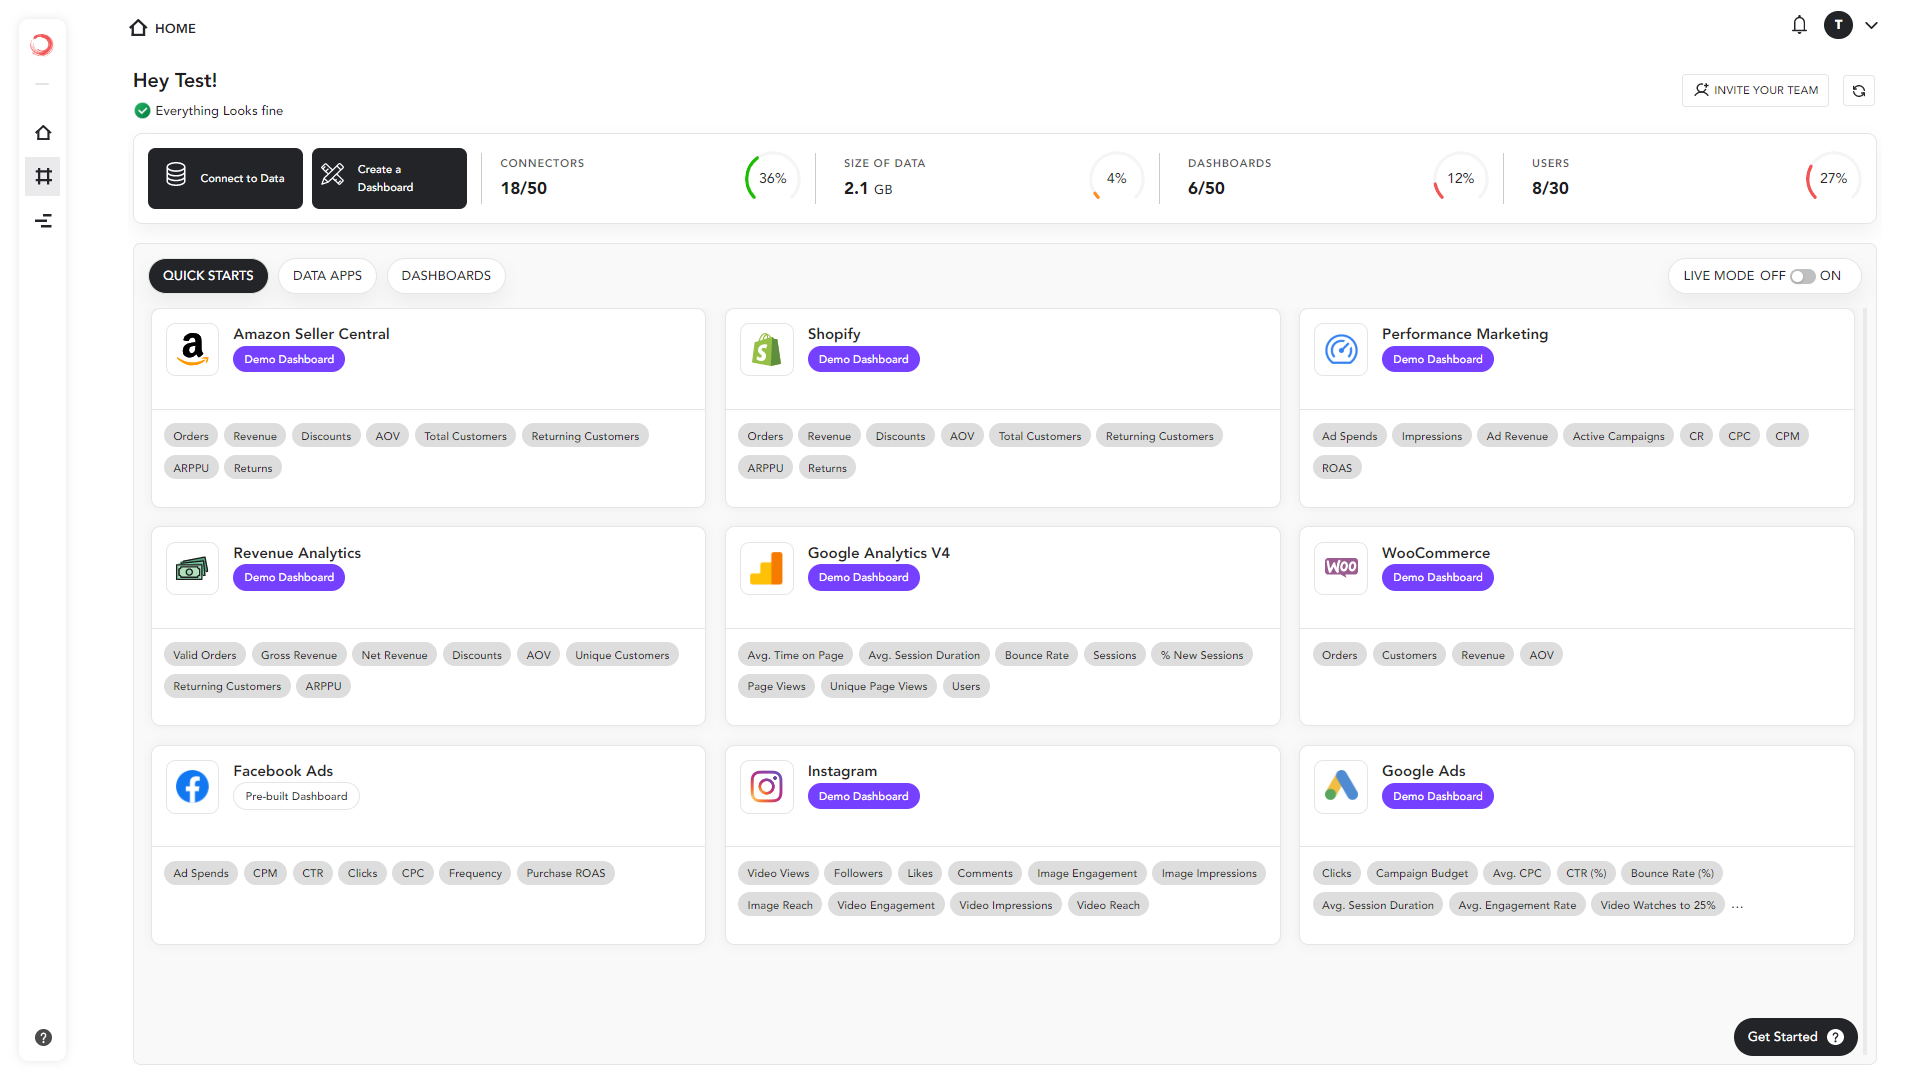
Templates
Propellor offers Templates, which are pre-built Dashboards to help you get your Dashboards built as quickly and efficiently as possible. These templates are a collection of popular reports built by data experts tailor-made for a particular type of data source.
Any of these Templates can be pulled into your Account right away, where they will automatically repopulate with your own unique data.
Learn more about Templates here.
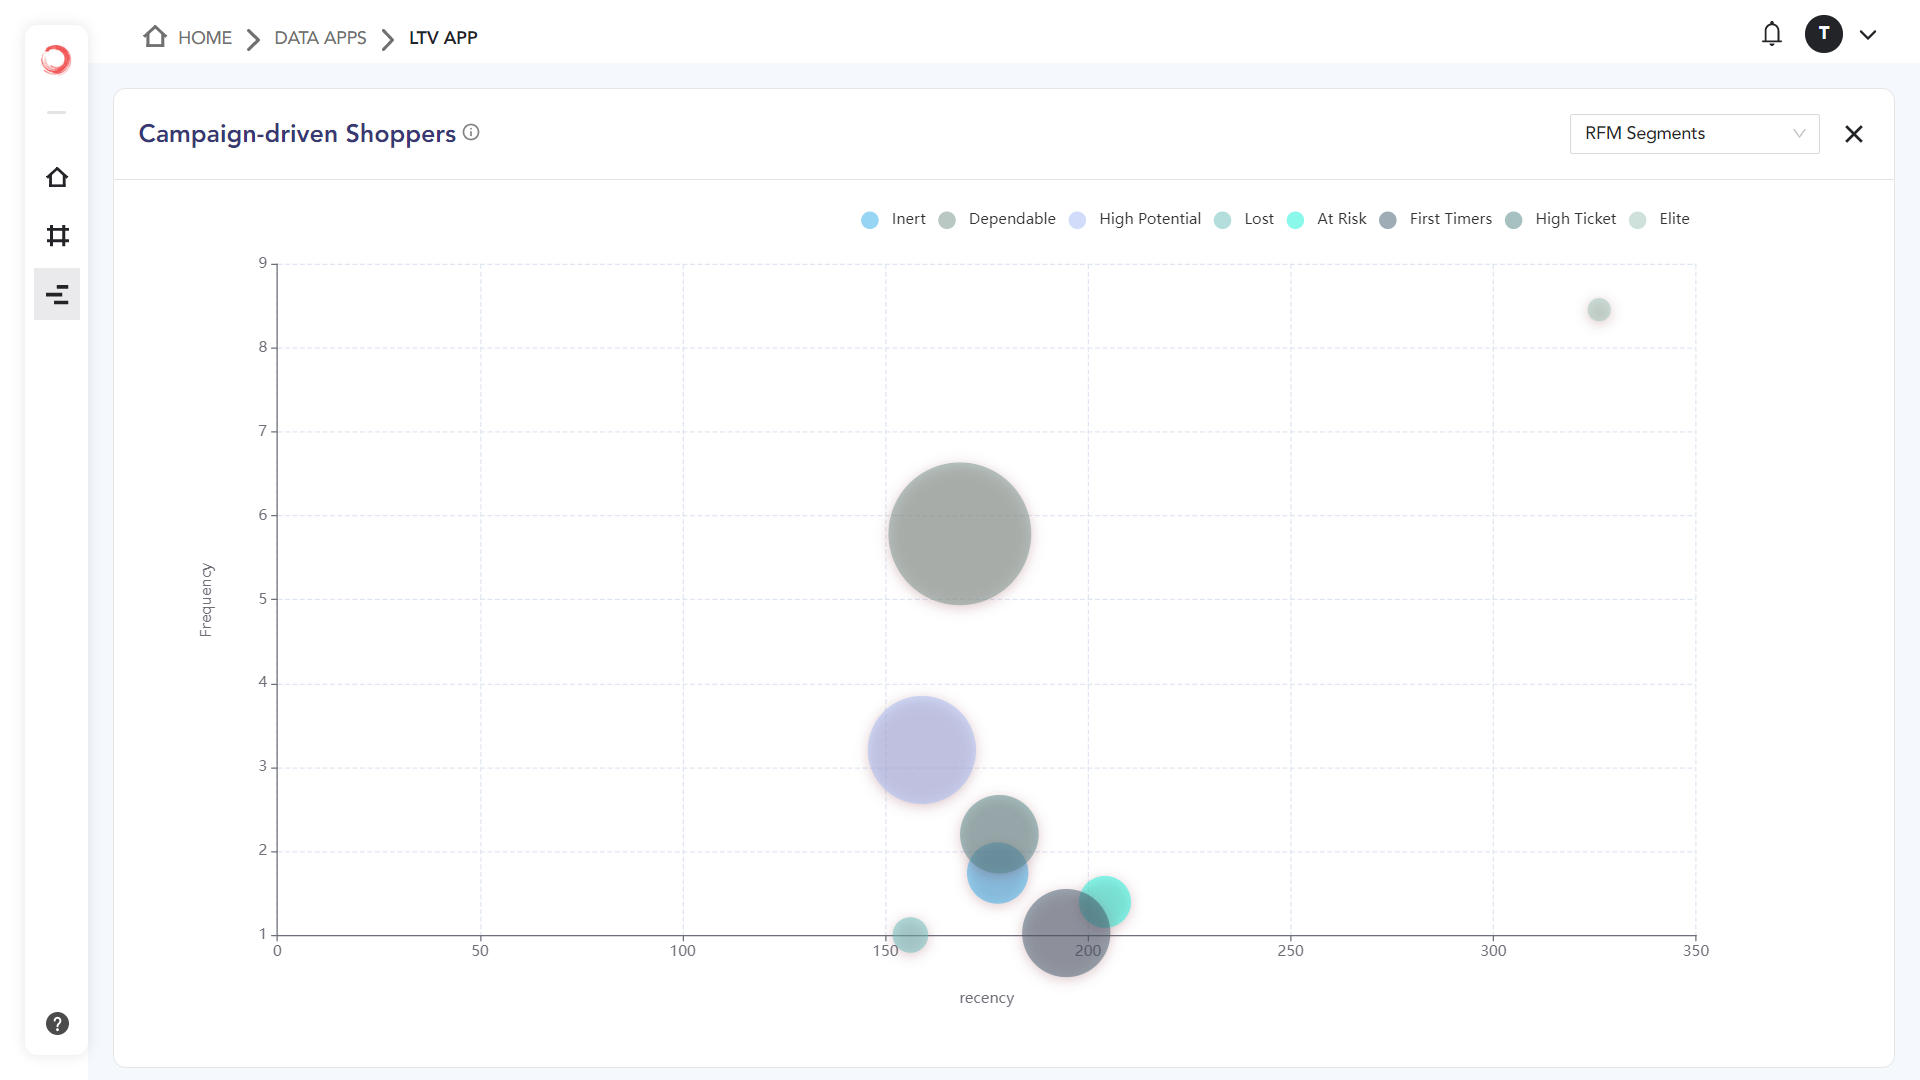
Data Apps
For a long time, product analytics was mostly about crunching numbers — total sales, revenue, net sales, average-order-value and so on. Later customers started getting prominence in these numbers — total customers, new acquisitions, returning customers, average-revenue-per-user etc. As time passed, realization dawned that behavioral/activity insights like which products do my customers prefer the most, when do they tend to visit the site, where do most of my orders come from, how do these preferences change over time etc. play a decisive role in driving those numbers.
In most of the marketing exercises, customers are segmented into buckets based on common traits. Each customer segment is marketed in a way that appeals to them so as to draw more visitors and purchases. This is where Data Apps come in to help segment the customers for better marketing. Propellor offers different apps like Lifetime Value App, Customer Journey and Market Basket Analysis to help you segment your customers in different so that your marketing can become more effective.
Learn more about Data Apps here.
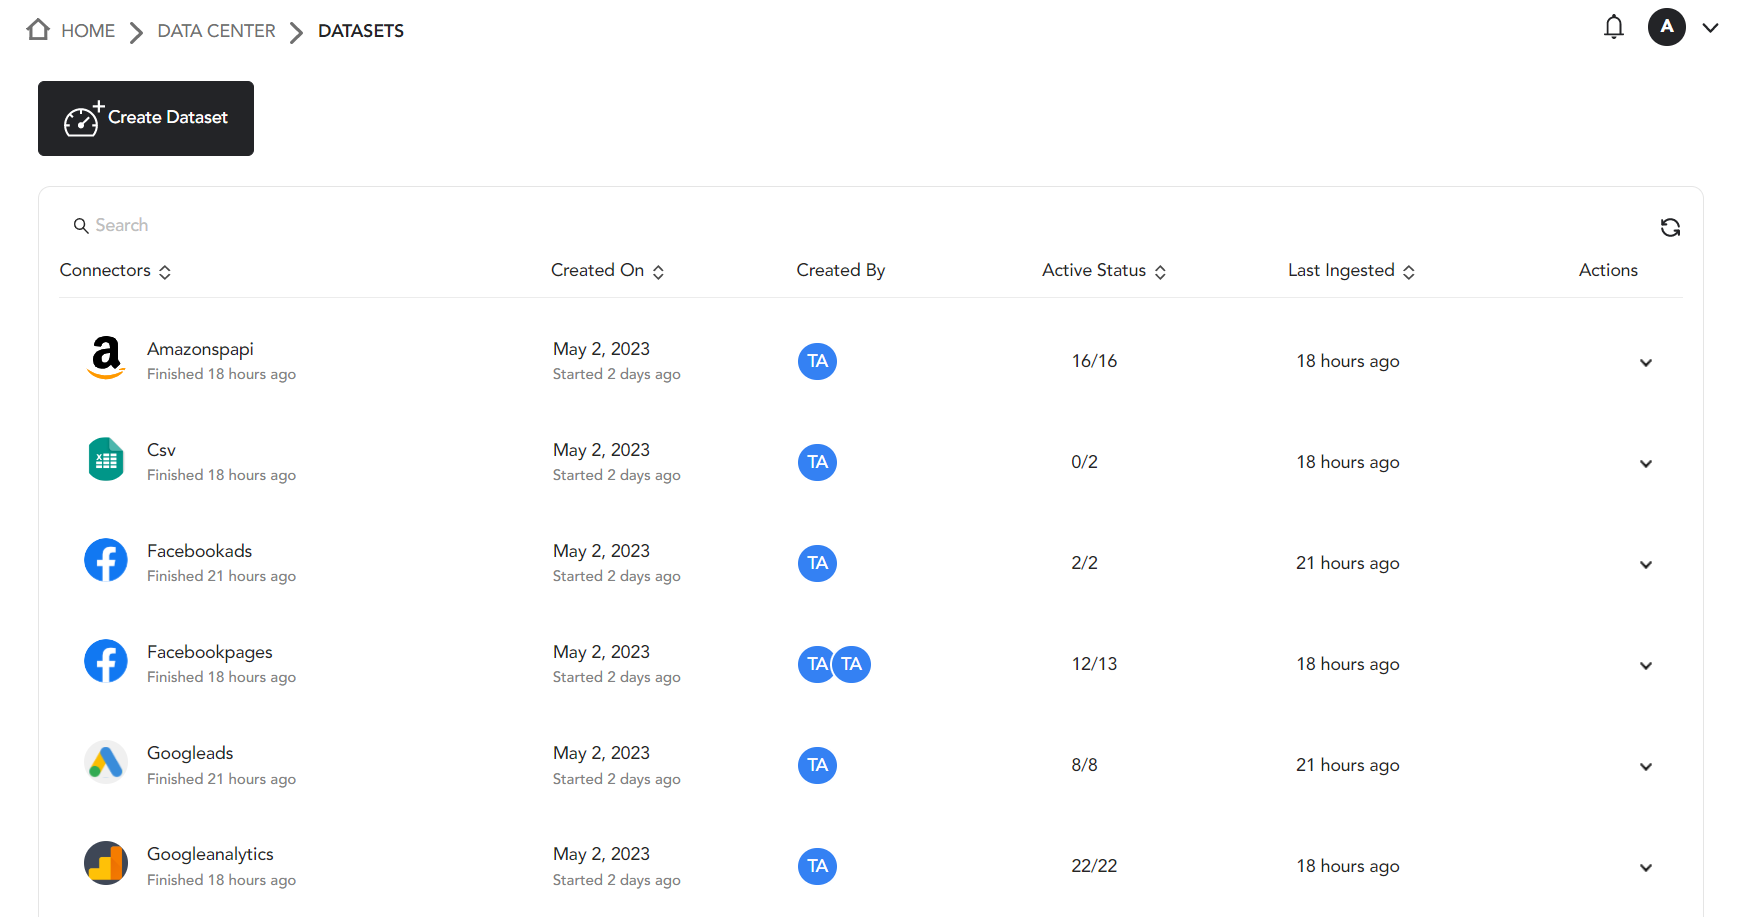
Data Center
A Data Set is a container that holds the data you upload to Propellor. You can see all the data you have ingested into Propellor updated regularly in datasets. You can use these datasets to create your own cards and in turn create your own dashboards in the data center.